


Treating ergonomic seating as a silver bullet for musculoskeletal health is a dangerous marketing gimmick. It compels consumers to spend heavily on pricey chairs while obscuring the fact that movement and healthy habits are the actual solution. To separate marketing from reality, ChairsFX paired multi-table U.S. Bureau of Labor Statistics (BLS) occupational injury data with longitudinal epidemiological surveillance.

The results expose a common-sense truth: movement is the primary solution to desk-worker health issues, while high-end chairs are merely supplemental tools.
Desk Worker Musculoskeletal Health Statistics
- Misrepresented Back Pain Statistics: The prevalence of lower back pain (LBP) rose by 60% between 1990 to 2020-2021. But excluding the elderly, LBP numbers actually dropped by 10.4%.
- 2014 Mobile & Cloud Tech Desk-Work Boom: The rise of social media fueled a massive surge in desk jobs.
- Desk Worker Injury Statistics: The median injured desk worker only missed 6 full workdays per year. However, recovery times from desk work musculoskeletal injuries were high: 25% of those injured missed 31 or more workdays per year.
- Rising Sedentary Behavior: Sedentary time spent gaming or using devices rose by 48% between 2014 and 2026.
- Skyrocketing Obesity: Severe obesity (BMI ≥ 40) climbed 26% from 2014-2023; 1 in 10 U.S. adults are now classified as obese.
Misrepresented Back Pain Statistics
Many marketers point to skyrocketing back pain statistics as the justification for buying pricey chairs. Indeed, on the surface, the numbers look alarming. The Global Burden of Disease (GBD) Study(1) shows that global low back pain cases surged by roughly 60%, rising from 386.7 million in 1990 to nearly 620 million in 2020–2021. Total cases are projected to hit 843 million by 2050 (a further 36.4% jump).

Look closer, however, and the “modern chair epidemic” narrative falls apart. Because low back pain prevalence peaks in the 80–84 age bracket, raw case totals are heavily skewed by global population growth and aging.
When adjusted for those demographic shifts, the global age-standardized prevalence rate of low back pain actually dropped by 10.4% between 1990 and 2020.
Furthermore, the GBD study found that 38.8% of all low back pain disability stems from three modifiable risk factors: occupational ergonomic stressors (manual lifting, awkward postures, and prolonged static positions), smoking, and high BMI.

So ask yourself: what actually solves prolonged static postures, smoking, and high BMI? Not a $2,500 chair. The answer is getting off your ass, moving your body regularly, and cutting out the daily habits that keep desk workers overweight, inflamed, and out of breath.
Below, we’ll dig further into the numbers to show how workplace injury rates, movement habits, and physical conditioning—not chair price tags—actually determine desk-worker health.
2014: Mobile and Cloud Tech Desk-Work Boom
In 2014, Facebook hit a milestone: 1 billion users per month. The same year, Mayo Clinic endocrinologist Dr. James Levine warned that “Sitting is the New Smoking.”

The world ignored him as the U.S. economy began shifting from desktop-bound internet to always-on mobile, social, and cloud ecosystems. This sparked a massive deskwork boom.
According to U.S. Bureau of Labor Statistics (BLS) data from 2014(2) and 2024(3), desk jobs increased in three key sectors:
- Computer and Mathematical Occupations: expanded by 35%, growing from 3.83 million workers in May 2014 to 5.18 million workers in May 2024.
- Management: grew from 6.74 million to 10.97 million (62.8%).
- Business and Financial Operations: grew from 6.83 million to 10.27 million (50.4%).
Work hours during this period remained steady at around 8.1 to 8.5 hours per day(4). However, leisure time spent playing games or using devices surged by 48% (from 25 minutes per day in 2015 to 37 minutes per day in 2025)(5).

By 2024, the population had become more inactive, heavier, and more prone to injuries. As a result, 1 in 4 injured desk workers (24.7%) was losing over a full month of work (31+ days), while herniated discs were sidelining workers for a median of 55 days(6).
Desk Worker Injury Statistics
That compounding cocktail of prolonged sitting and off-clock device use eventually manifests in federal injury logs.

U.S. Bureau of Labor Statistics data from 2023 to 2024 (Table R9(7)) combines six pure desk-bound occupational categories—Financial Clerks, Information & Record Clerks, Secretaries & Administrative Assistants, Other Office & Administrative Support, Computer & Mathematical, and Business & Financial Operations. These statistics exclude warehouse, shipping, and mailroom clerks. Totals:
| Case / Absence Type | Total Cases | 1–5 Days | 6–10 Days | 11–30 Days | 31+ Days | Group Median Days | % of Annual Workdays (250-day FTE) |
| DAFW (Days Away From Work) | 58,970 | 29,020 (49.2%) | 7,190 (12.2%) | 8,210 (13.9%) | 14,580 (24.7%) | 6 days | 2.4% |
| DJTR (Job Transfer / Restriction) | 25,950 | 4,970 (19.2%) | 4,290 (16.5%) | 6,570 (25.3%) | 10,120 (39.0%) | 21 days | 8.4% |
| DART (Total Combined Impact) | 84,920 | 30,230 (35.6%) | 11,370 (13.4%) | 14,590 (17.2%) | 28,730 (33.8%) | 11–12 days | 4.4%–4.8% |
Looking at what caused those 58,970 time-off cases (BLS Table R12(8)), the last three categories directly reflect desk-work and ergonomic strain:
- Bodily Position, Motion, and Static Posture (7.3% — 4,320 cases): Direct ergonomic/postural failure. In BLS event classifications, this captures injuries triggered without external force—simply sitting in awkward or static positions, leaning/twisting at a desk, or rising from a chair after prolonged spinal loading.
- Repetitive Microtasks like Typing and Mousing (4.2% — 2,450 cases): Direct workstation ergonomics issue. This captures cumulative trauma from high-frequency, low-force peripheral input (carpal tunnel, tendinitis, wrist/forearm strain) caused by poor keyboard/mouse placement and lack of forearm support.
- Overexertion and Bodily Reaction (21.7% — 12,790 cases): Broader musculoskeletal & deconditioning proxy.
On the surface, deskwork-related issues seem trivial: the median injured worker missed 6 full workdays (DAFW), or 2.4% of their annual workdays (based on a standard 250-day work year). However:
- A BLS DAFW record requires a physician-certified, work-related injury serious enough to file an OSHA Form 300/301 log or workers’ compensation claim.
- The 6-day median splits the dataset in half, which masks extreme severity on the upper end. In BLS Table R66(9), roughly half of injured desk workers returned within 5 days. However, 38.6% (22,790 workers) missed 11 or more workdays, and 24.7% (14,580 workers—nearly 1 in 4) were sidelined for 31 or more workdays.
When you isolate pure musculoskeletal disorders in Table MSD1(10), recovery timelines spike dramatically:
- Carpal Tunnel Syndrome: 28 median days away from work
- Herniated / Disc Disorders: 55 median days away from work
- Cervical Radiculopathy (pinched neck nerve): 60 median days away from work
- Epicondylitis (tennis elbow): 68 median days away from work
Key Takeaway: 1 in 4 injured desk workers lost over a full month of work (31+ days) due to sitting-related musculoskeletal disorders.
Sedentary Behavior Statistics
To see how a decade of screen-based work and off-clock device habits compounded into measurable physical decline, we tracked longitudinal federal benchmarks against the latest public health surveillance data.

The resulting timeline highlights a clear structural convergence: while daily work hours remained locked at over eight hours per day, white-collar desk headcounts and leisure screen time surged, driving higher rates of physical inactivity, obesity, and severe, long-tail musculoskeletal absences:
| Metric | 2014–2015 Baseline | Latest Data (2024–2026) | Net Change / Impact | Primary Source |
| Computer & Mathematical Employment | 3.83 million (May 2014) | 5.18 million (May 2024) | +35.0% (+1.35M workers) | BLS OEWS (May 2014(2) vs. May 2024(3)) |
| Management Employment | 6.74 million (May 2014) | 10.97 million (May 2024) | +62.8% (+4.23M workers) | BLS OEWS (May 2014(2) vs. May 2024(3)) |
| Business & Financial Operations Employment | 6.83 million (May 2014) | 10.27 million (May 2024) | +50.4% (+3.44M workers) | BLS OEWS (May 2014(2) vs. May 2024(3)) |
| Average Daily Work Hours (Employed Persons) | ~8.1–8.5 hrs/day | ~8.1–8.5 hrs/day (2025 avg) | Unchanged (High sustained sitting load) | BLS ATUS Table 6 (2025 Annual Averages)(4) |
| Daily Leisure Gaming & Device Use | 25 mins/day (2015) | 37 mins/day (2025) | +48.0% (+12 mins/day off-clock screen time) | BLS ATUS Table 1 (2025 Annual Averages)(5) |
| U.S. Adult Obesity Prevalence | 37.7% (2013–2014) | 40.3% (Aug 2021–Aug 2023) | +2.6 percentage points (9.7% severe obesity) | CDC NCHS Data Brief No. 508(11) |
| Global Adult Physical Inactivity | 27.5% (2016 baseline) | 31.3% (2022 global / ~1.8B adults) | +3.8 percentage points (Trending toward 35% by 2030) | WHO / The Lancet Global Health (2024)(12) |
| Severe Desk-Worker Injury Absence (31+ Days) | — (Biennial baseline reset) | 24.7% of DAFW cases (14,580 workers) | Nearly 1 in 4 injured desk workers miss 1+ month | BLS SOII Table R66 (2023–2024 Biennial)(9) |
Rising Obesity Statistics
Prolonged sitting does not just degrade posture—it flattens daily non-exercise energy expenditure (NEAT) and drives metabolic dysfunction.

Tracking National Health and Nutrition Examination Survey (NHANES) data(11) over the same decade reveals how rising screen time and declining daily movement translated into higher body mass across U.S. adults.
While overall obesity ticked down slightly from its 2017–March 2020 peak of 41.9% to 40.3% in the latest August 2021–August 2023 cycle, severe obesity (BMI ≥ 40) continued climbing uninterrupted—jumping from 7.7% in 2013–2014 to 9.7%:
| Survey Cycle | Overall Obesity (BMI ≥ 30) | Severe Obesity (BMI ≥ 40) |
| 2013–2014 | 37.7% | 7.7% |
| 2015–2016 | 39.6% | 7.7% |
| 2017–March 2020 | 41.9% | 9.2% |
| August 2021–August 2023 (Latest NHANES) | 40.3% | 9.7% |
Key Takeaway: While headline obesity plateaued slightly after 2020, severe obesity (BMI ≥ 40) climbed 26% over the decade—meaning nearly 1 in 10 U.S. adults now carry extreme metabolic and axial spine loads that dramatically amplify seated disc compression and lower-body vascular strain.
Movement—Not Fancy Furniture—Is the Solution
Epidemiological data confirms that regular physical activity—not ergonomic hardware—neutralizes the health risks of desk work.
While Dr. James Levine’s 2014 claim that “sitting is the new smoking” made headlines, the numbers tell a very different story: heavy smoking increases premature mortality risk by roughly 180%, compared to just 10% to 20% for sitting over eight hours daily.
Better yet, 60 to 75 minutes of moderate daily movement (such as brisk walking) virtually eliminates that sitting-related risk.(14)
Movement Beats Sync-Tilt Mechanisms
Chair brands routinely justify four-figure price tags by touting synchronous tilt—a mechanism that reclines the backrest and seat pan at a fixed ratio to promote “dynamic sitting.”

The Audit Verdict: Rocking back in an expensive chair does not replicate actual physical activity. A systematic review of dynamic seating research found no conclusive evidence that synchro-tilt or dynamic chair mechanisms prevent back pain or improve musculoskeletal health.
Rather, muscle activation and joint relief depend on what you do outside the chair—standing, walking, and stretching—not how smoothly your seat pan reclines.
Standing Desks Trade One Static Posture for Another
The same principle—that actual movement beats expensive hardware—shows up in clinical research on standing desks. By the late 2010s, studies by Dr. Alan Hedge at Cornell(15) and Dr. Jack Callaghan at the University of Waterloo(16) showed that prolonged static standing triggers its own cascade of pathologies:
- Lower-limb venous pooling and varicose veins
- Increased carotid atherosclerosis risk
- Plantar fasciitis and knee joint compression
- Acute lower-back pain (up to 50% of previously asymptomatic subjects develop lumbar pain within 2 hours of continuous standing)
Key takeaway: standing doesn’t fix excessive sitting problems because standing is still a static posture.
Scientific Consensus Shifted to Movement
Realizing the limitations of both extremes, ergonomics and occupational medicine quietly retired the anti-sitting panic in favor of two evidence-based principles:
- Static Load Is the Enemy, Not Chairs: Whether sitting or standing, holding the spine and musculature in a fixed, unmoving position starves intervertebral discs of nutrient exchange (which relies on osmotic pumping from movement) and creates sustained low-level muscle ischemia(17).
- Micro-Breaks and Dynamic Support: Current occupational health frameworks (including OSHA and ISO ergonomics guidelines) emphasize frequent postural transitions (alternating sitting, reclined postures, and brief standing/walking breaks every 30–60 minutes) paired with dynamic seating that supports the spine across multiple recline angles rather than forcing an upright 90-degree perch(18).
ChairsFX IT Worker Survey: Habits Beat Hardware
That exact clinical consensus—that daily movement habits matter far more than expensive office hardware—shows up directly in our own proprietary research.

In December 2025, ChairsFX surveyed 200 full-time U.S. IT professionals (split equally between remote and on-site environments).
With an estimated 5 million IT workers in the U.S., a sample of this size carries a 95% confidence margin of error of ±7%. This means that our findings statistically expected to fall within seven percentage points above or below the figure shown.
Even with that margin of error, the results align squarely with the federal data above:
- Chronic Pain Prevalence: 69.3% of remote workers and 76.0% of on-site workers in our data set report weekly work-disrupting pain rated 5/10 or higher.
- The Ergonomic Equipment Illusion: Equipment alone does not prevent discomfort. Among pain-free on-site workers, 75% use basic, non-ergonomic seating—the highest rate of non-ergonomic chair use in any surveyed cohort, outstripping even workers reporting daily chronic strain. Across the full sample, roughly 60% rely on standard chairs.
- The Exercise and Movement Divide: Within remote cohorts, physical conditioning serves as a primary separator: pain-free workers are three times more likely to exercise 5+ days a week (34.65%), whereas pain sufferers are five times more likely to get zero weekly exercise (21.43%). Furthermore, pain-free remote workers take significantly more movement breaks (40.59% taking 5+ breaks daily).
- Energy Depletion: Pain—not job location—is the primary drain on daily vitality. Roughly 70% to 74% of pain-free workers across both remote and on-site environments finish the workday with moderate-to-high energy, whereas on-site pain sufferers experience severe depletion, with 57.89% reporting low energy (scores of 1–2 out of 5).
Key Takeaway: Our IT desk worker survey aligns with the broader national data in two clear ways. First, it confirms that an overwhelming majority of desk workers suffer chronic, work-disrupting pain.

Second, it shows that daily movement and exercise habits—not furniture choices—are the primary drivers of physical resilience and workday energy.
What Ergonomic Chairs Actually Do Well
Lost in the tribalistic gaming chair vs office-chair debate is a straightforward, evidence-backed reality established across more than three decades of human factors research—and echoed by OSHA, BIFMA, and the Handbook of Human Factors and Ergonomics.
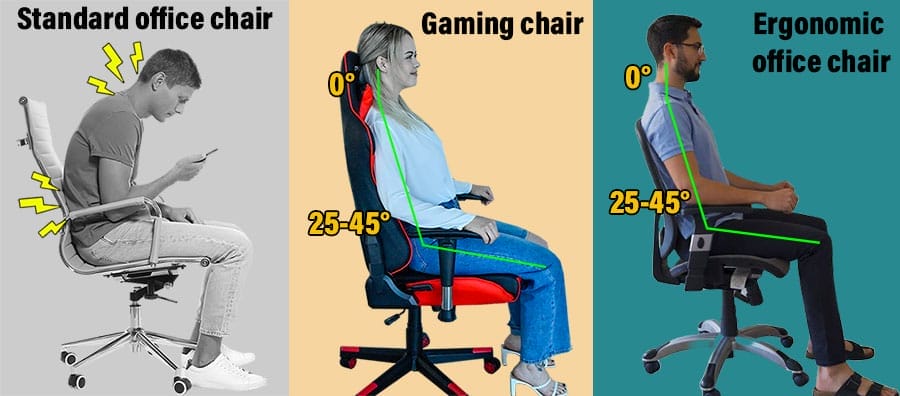
Any chair equipped with adjustable lumbar support, multi-directional armrests, and a reclining backrest qualifies as ergonomic. Those components exist to support neutral sitting posture, which delivers four practical benefits:
- Reduced muscular fatigue during long sessions: By offloading shear stress and passive tension from your spine and shoulders, neutral support conserves energy and delays the physical drain that ruins afternoon focus.
- A physical benchmark for healthy alignment: You cannot correct slumping if you do not know what proper alignment feels like. Consistent lumbar and backrest contact teaches your body a clean neutral reference (~0° neck tilt and a natural ~25–45° lumbar curve).
- Reinforced postural habits: Your neuromuscular system adapts to the positions you hold most frequently. Sitting with proper support makes upright alignment feel familiar rather than forced.
- Clearer feedback on weak links: Once you recognize what neutral posture feels like, you immediately notice which muscles fatigue first—pinpointing exact weaknesses in your core, upper back, or neck to target in the gym.
The Bottom Line: A well-fitted chair minimizes mechanical strain and slows fatigue while you work, but its job ends there. As Doctor of Physical Therapy William Duncan explained to ChairsFX readers:
The Validated ChairsFX Methodology
The results of this article’s data analysis directly validate the ChairsFX methodology. After eight years of documenting scattered ergonomic science, testing concepts firsthand, and consulting with esports doctors, I reached a conclusion: an ergonomic chair is only the starting point for desk work optimization—not the finish.

While a well-built chair supports neutral posture, it cannot actively create postural health or endurance.
Workers who remain stationary for hours or lack the physical capacity to resist gravity will inevitably face cognitive fatigue and physical breakdown, regardless of their equipment’s price tag.
Bottom Line: Train Like a Cognitive Athlete
For desk workers looking to maximize daily output, treating yourself like a cognitive athlete is the highest-yield strategy available.
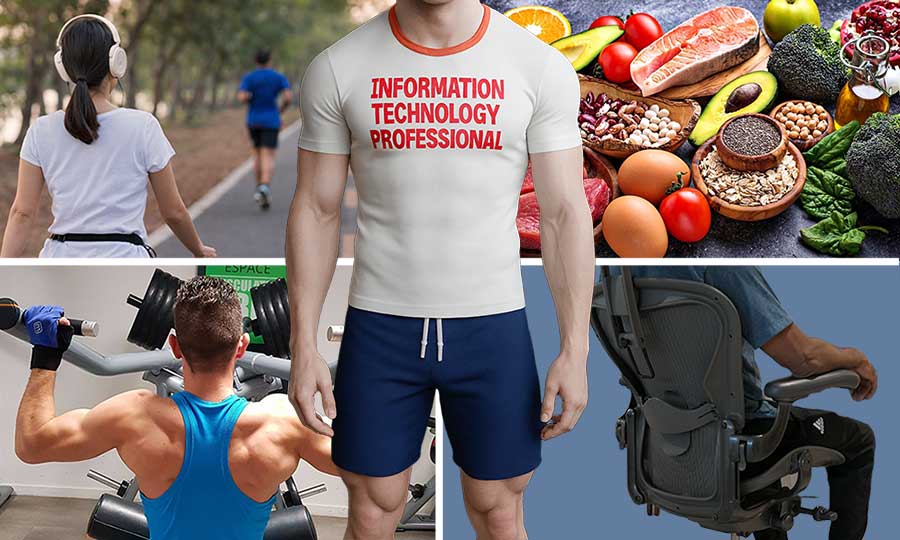
Building muscular armor outside of work hours and micro-dosing movement breaks throughout the day protects your energy reserves and boosts focus far better than relying on an ergonomic silver bullet.

Ultimately, a good ergonomic chair is a useful tool, but your active daily habits dictate your performance edge.
Footnotes
- GBD 2021 Low Back Pain Collaborators. ‘Global, regional, and national burden of low back pain, 1990–2020, its attributable risk factors, and projections to 2050: a systematic analysis of the Global Burden of Disease Study 2021’. The Lancet Rheumatology, 5(6), e316–e329, June 2023. DOI: 10.1016/S2665-9913(23)00098-X, (accessed 18 Nov. 2026).
- U.S. Bureau of Labor Statistics (BLS). ‘May 2014 National Occupational Employment and Wage Estimates’. U.S. Department of Labor, March 25, 2015. https://www.bls.gov/oes/2014/may/oes_nat.htm, (accessed 16 Nov. 2026).
- U.S. Bureau of Labor Statistics (BLS). ‘May 2024 National Occupational Employment and Wage Estimates’. U.S. Department of Labor, April 2, 2025. https://www.bls.gov/oes/2024/may/oes_nat.htm, (accessed 16 Nov. 2026).
- U.S. Bureau of Labor Statistics (BLS). ‘American Time Use Survey — Table 6: Employed persons working and time spent working at home and at their workplace, 2025 Annual Averages’. U.S. Department of Labor, June 25, 2026. https://www.bls.gov/news.release/atus.t06.htm, (accessed 16 Nov. 2026).
- U.S. Bureau of Labor Statistics (BLS). ‘American Time Use Survey — Table 1: Time spent in primary activities and percent of the civilian population engaging in each activity, averages per day by sex, 2025 Annual Averages’. U.S. Department of Labor, June 25, 2026. https://www.bls.gov/news.release/atus.t01.htm, (accessed 16 Nov. 2026).
- U.S. Bureau of Labor Statistics (BLS). ‘Survey of Occupational Injuries and Illnesses (SOII), 2023–2024 Biennial Data — Table R66 & Table MSD1 (Nonfatal Occupational Injuries and Illnesses Requiring Days Away From Work)’. U.S. Department of Labor, November 2025. https://www.bls.gov/iif/nonfatal-injuries-and-illnesses-tables.htm, (accessed 16 Nov. 2026).
- U.S. Bureau of Labor Statistics (BLS). ‘Survey of Occupational Injuries and Illnesses (SOII), 2023–2024 Biennial Data — Table R9: Number of nonfatal occupational injuries and illnesses involving days away from work by occupation and selected natures of injury or illness’. U.S. Department of Labor, November 2025. https://www.bls.gov/iif/nonfatal-injuries-and-illnesses-tables.htm, (accessed 17 Nov. 2026).
- U.S. Bureau of Labor Statistics (BLS). ‘Survey of Occupational Injuries and Illnesses (SOII), 2023–2024 Biennial Data — Table R12: Number of nonfatal occupational injuries and illnesses involving days away from work by occupation and selected events or exposures leading to injury or illness’. U.S. Department of Labor, November 2025. https://www.bls.gov/iif/nonfatal-injuries-and-illnesses-tables.htm, (accessed 17 Nov. 2026).
- U.S. Bureau of Labor Statistics (BLS). ‘Survey of Occupational Injuries and Illnesses (SOII), 2023–2024 Biennial Data — Table R66: Number and percent distribution of nonfatal occupational injuries and illnesses involving days away from work by occupation and number of days away from work’. U.S. Department of Labor, November 2025. https://www.bls.gov/iif/nonfatal-injuries-and-illnesses-tables.htm, (accessed 17 Nov. 2026).
- U.S. Bureau of Labor Statistics (BLS). ‘Survey of Occupational Injuries and Illnesses (SOII), 2023–2024 Biennial Data — Table MSD1: Number, incidence rate, and median days away from work for nonfatal occupational injuries and illnesses involving days away from work with musculoskeletal disorders by selected worker and case characteristics’. U.S. Department of Labor, November 2025. https://www.bls.gov/iif/nonfatal-injuries-and-illnesses-tables.htm, (accessed 17 Nov. 2026).
- Emmerich SD, Fryar CD, Stierman B, Ogden CL. ‘Obesity and Severe Obesity Prevalence in Adults: United States, August 2021–August 2023 (NCHS Data Brief No. 508)’. Centers for Disease Control and Prevention (CDC), National Center for Health Statistics (NCHS), September 2024. https://www.cdc.gov/nchs/products/databriefs/db508.htm, (accessed 17 Nov. 2026).
- Strain T, Flaxman S, Guthold R, et al. ‘National, regional, and global trends in insufficient physical activity among adults from 2000 to 2022: a pooled analysis of 507 population-based surveys with 5.7 million participants’. The Lancet Global Health, August 2024. https://www.thelancet.com/journals/langlo/article/PIIS2214-109X(24)00150-5/fulltext, (accessed 17 Nov. 2026).
- Vallance, J. K., Gardiner, P. A., Lynch, B. M., D’Silva, A., Boyle, T., Taylor, L. M., Johnson, S. T., Buman, M. P., & Owen, N. ‘Evaluating the Evidence on Sitting, Smoking, and Health: Is Sitting Really the New Smoking?’. American Journal of Public Health, 108(11), 1478–1482, November 2018. DOI: 10.2105/AJPH.2018.304649, (accessed 17 Nov. 2026).
- Ekelund, U., Steene-Johannessen, J., Brown, W. J., Fagerland, M. W., Owen, N., Powell, K. E., Bauman, A., & Lee, I. M. ‘Does physical activity attenuate, or even eliminate, the detrimental association of sitting time with mortality? A harmonised meta-analysis of data from more than 1 million men and women’. The Lancet, 388(10051), 1302–1310, September 2016. DOI: 10.1016/S0140-6736(16)30370-1, (accessed 17 Nov. 2026).
- Hedge, A. ‘Effects of an Electric Height-Adjustable Worksurface on Self-Assessed Musculoskeletal Discomfort and Productivity in Computer Workers’. Cornell University Human Factors and Ergonomics Laboratory, September 2004. https://ergo.human.cornell.edu/Pub/HFlabReports/EHARep0904.pdf, (accessed 17 Nov. 2026).
- Viggiani, L. R., & Callaghan, J. P. ‘Standing desks may lead to lower back pain’. Journal of Applied Biomechanics / University of Waterloo Research, April 2018. https://uwaterloo.ca/health/news/standing-desks-may-lead-lower-back-pain, (accessed 17 Nov. 2026).
- Hutton, W. C., Malko, J. A., & Fajman, W. A. ‘Lumbar intervertebral disc volume changes during simulated microgravity and axial loading’. Spine, 28(14), 1538–1542 / PubMed, July 2003. https://pubmed.ncbi.nlm.nih.gov/12865841/, (accessed 19 Nov. 2026).
- International Organization for Standardization (ISO). ‘ISO 9241-5:2024 – Ergonomics of human-system interaction — Part 5: Workstation layout and postural requirements’. ISO Standards, September 2024. https://www.iso.org/standard/86222.html, (accessed 19 Nov. 2026).

